
Introduction: Why Crises Are the Best Teachers
"Strait of what?" This is the likely answer you would have had at the start of the year, had you started a conversation on the Strait of Hormuz. Only a minority of people knew where it was and why it mattered. And fair enough: unless you work in commodities or have a genuine interest in the Middle East or geography more broadly, this had little bearing on your day-to-day.
And yet, today, and for months now, you hear that name at least once a day. This narrow waterway is the route for roughly one-fifth of the world's oil supply. Well, used to be at least, as it has been largely closed following the outbreak of the US-Iran war in late February. The International Energy Agency described it as the worst supply disruption in history and, a few days ago, warned once again of a growing risk to energy supplies.
By any historical measure, what happened to global oil markets in 2026 should have caused an economic earthquake... More than 14 million barrels per day were removed from global markets. And yet, as of 10 August, Brent crude is trading in the $82-88 range, only.
There is no better way to understand how a market works than to study it under stress.
In normal conditions, markets are opaque. Prices move, participants trade, goods flow but the underlying mechanics remain hidden. The buffers that absorb shocks are invisible until they are gone. The structural dependencies that bind suppliers to customers are taken for granted until they break. The power relationships between producers, intermediaries, and consumers only become visible when they are put under pressure.
I am convinced that this is true for any market. The 2008 financial crisis revealed the hidden architecture of the global banking system (at the time, the leverage, the interconnections, the reliance on short-term funding) in ways that years of academic study had not. The COVID pandemic exposed the fragility of global supply chains for everything from semiconductors to basic pharmaceuticals. And the 2026 Iran war, the subject of this article, has done the same for global energy markets.
The war showed us who the real buyers are, which supply chains were held together by contingency assumptions, and which countries were more exposed than their official statistics said. It also settled an argument about the word strategic reserve.
It is not an infinite cushion. It is a buffer, and buffers run out.
A couple of notes before we dive deeper. Firstly, this article will often quote oil prices. I have been using Brent as a benchmark, with the FT as my source for prices. Therefore, I will, unless explicitly mentioned, always be referring to the Brent Crude Oil front-month futures traded on the Intercontinental Exchange (ICE) Europe (ticker: IB.1:IEU). I may take the shortcut to express it in /bbl.
Secondly, this article took me close to three weeks to write. I am writing these words on a late night of 10 August and had to adjust a few paragraphs here and there to reflect the latest price movements. I may have missed an update or two, in which case I apologise. This however reflects one thing: the oil markets had never experienced such acute volatility. In an era of quasi-instantaneous information, markets now adjust within milliseconds, without always taking a step back on the news itself. We will nevertheless learn in this article that physical markets adjust on their own terms and timelines.
The Paradox of a Contained Catastrophe
Since the beginning of the war earlier this year, we've seen many headlines mentioning extreme volatility in the oil markets, with prices going up and down with Trump's announcements and actions, together with the strikes from the Iranians. For most people, these figures tell nothing until they see them reflected in the prices they pay at the pump. And most of the time, it leaves them confused: "why on earth am I still paying my fuel that high when I read everywhere that oil prices have crashed?"
The general principle is that prices rocket up and drift down like a feather. Refiners pass rising crude through immediately to protect margin, but when crude falls they are sitting on inventory bought higher, so they hold until the old stock clears, typically two to six weeks. And hedges roll over on their own schedule, which insulates in one direction and bites in the other.
I would argue this is not a phenomenon restricted to the oil markets. We just tend to not notice it with other goods as these are bought either less regularly, or in lesser quantity, or in a supermarket alongside many other items, hence less tracking of the price.
With the restart of the war between the US and Iran in late July, Brent crude oil prices have spiked from their recent low of 100/bbl towards the end... before falling back to the low 80s ten days within August. Pre-war, we had not seen such levels since 2022, but it remains nothing close to the all-time highs seen during the 2008 financial crisis or the 1970s oil shocks. Goldman Sachs, one of the banks that has studied these dynamics most closely, warned that prices could surge to 80 for Q4-26, as their base case scenario assumes an easing of the tensions. A week ago, the US President Donald Trump promised to crash oil to $55 post-war.
Why on earth would the worst supply shock in modern history be contained by relatively moderate price increases? This apparent contradiction is not a sign that markets are fine. It only demonstrates that markets are complex, and that the visible price of a barrel of oil tells only part of the story. The real story lies in the buffers that have been quietly drawn down, the secondary markets that have quietly exploded in price, and the structural fragilities that will become impossible to ignore the moment those buffers run out.
With this article, I want to explain how oil markets actually work. Not in theory, but in practice, as we've got a live example to build on. I believe that understanding energy markets is one of the most rewarding intellectual investments you can make, and the resources throughout will help you go deeper. A serious understanding of how energy markets work is how you decode what is happening at the geopolitical level. And the other way around.
If you want to start with the single best historical foundation for understanding the oil industry, there is no better place than The Prize: The Epic Quest for Oil, Money, and Power by Daniel Yergin (Simon & Schuster, 1991). Pulitzer Prize winner. Nearly 1,000 pages, so a heavy read. I am still working my way through it.
Where I Land, and What Would Prove Me Wrong
Here is where I land, before we get into the mechanics.
The visible price of oil has been telling a far calmer story than the physical market. Brent spent most of this crisis below $100 while Omani crude set records, Asian refiners cut runs, and product cracks hit four-year highs. That gap is the subject of this article.
It was held open by buffers: strategic reserve releases, China drawing down its own stocks, Russian crude redirected east, and commercial inventories that happened to be full when the war started. Having spent thirteen years structuring energy transactions, I cannot remember a period when all of them were drawn at the same time. They are now close to spent.
That is the short-term case, and I believe it. But a second argument runs the other way on a longer clock: OPEC+ is raising output for the sixth month running, the UAE has walked out of the cartel, and the IEA now expects global oil demand to fall this year.
Both things are true at once, and most of the confusion in the price is those two clocks disagreeing.
I will come back at the end to what I am watching, and to what would tell me I got this wrong.
Part 1: The Geopolitical Trigger
Why the Strait of Hormuz Matters
The Strait of Hormuz is 33 kilometres wide at its narrowest point, between Iran and Oman. Through this chokepoint flows approximately 20% of global oil and about 25% of the world's LNG. Before the war, it was estimated that over 130 vessels were crossing through the strait each day, of which roughly half of them were oil tankers. Together, they moved every single day around 20 million barrels.
There is no viable alternative route for the landlocked producers of the Persian Gulf: Kuwait, Iraq, the UAE, Qatar, and Bahrain have no access to open water except through the Strait. Saudi Arabia can reroute some exports through its Red Sea facilities, but its capacity via this alternative is far below its normal export volumes.
When the US-Iran war broke out in late February 2026, Iran's ability (and willingness) to threaten transit through Hormuz became the central variable in global energy markets. Within weeks, traffic through the strait had slowed to a quasi-embargo level. At least five ships were hit. Most shipping companies suspended their activity in the area and less than a handful of vessels are now going through each day. Many are turning off their AIS and GPS transponders in an attempt to completely conceal their movement.
Only a few more audacious companies saw an opportunity there to make serious money, at the very high risk of getting their vessels struck or seized. No later than last week, a tanker, operated by the Greek company Dynacom, attempted to use the relatively protected Omani coastal route, but was eventually struck by Iranian missiles and later seized by the Iranians.
No wonder maritime insurance costs for vessels in the Gulf have soared since the start of the war, for those who still accept to cover such voyages. War-risk cover went from 1-3% to 7.5-10% of hull value. Ordering a newbuilding was estimated at c. 10-13 million**, when available, compared with less than $4 million pre-war.
Consequently, freight rates in the region have soared, as per a report published by S&P Global last week. In this report, we learn that Platts had estimated the current rates for a voyage from the Persian Gulf to China at 18.91/mt, four times lower! At current rates, this means a total freight cost of slightly over $20 million for a standard 270,000-metric-tonne tanker.
To add to these risks, Iran has also been suspected of mining the strait. This has long-term consequences that extend far beyond any ceasefire. Removing underwater mines is extraordinarily difficult, time-consuming, and dangerous. Even if hostilities end tomorrow, the presence of mines in Hormuz would make the waterway hazardous for months or years, fundamentally changing the risk calculus for shipping companies and their insurers. It is worth saying that even the suspicion of mines is sufficient for some underwriters to decline cover.
It is also worth noting that ship financiers also restrict operations in war zones, dangerous waters, or sanctioned territories. The rationale is very simple: in standard ship financings, lenders have a mortgage over the vessel. Because the vessel serves as the primary physical collateral for the debt, financiers protect their security interest and underlying cash flows through specific contractual mechanisms.
Why the Middle East Wants This Over
Iranians do not have the capabilities to strike the US on their soil. And rather than just defending itself, Iran has been fighting the US through proxies, targeting US bases in the Middle East, but also oil, gas, and shipping infrastructure of Saudi Arabia, the UAE, Kuwait, Qatar, or even Oman. The Gulf states are all absorbing enormous collateral damage. Their carefully built reputations as stable, investable markets are taking a serious hit. Tourism, foreign investment, and trade flows are all under pressure. They are spending billions on additional defence. And to top it up, they are generating far less revenue from oil and gas exports than they would otherwise, putting their budgets at risk.
These are countries that have spent decades carefully diversifying their economies away from oil dependency: NEOM in Saudi Arabia, the Vision 2030 programme, the UAE's pivot to finance, tourism, and technology. A prolonged conflict undoes years of that work. Naturally, they want the Strait open as soon as possible. They have every incentive to push hard for a settlement through diplomatic channels.
As we mentioned before, Saudi Arabia has access to the Red Sea, but oil terminals are not sized to absorb all the volumes disrupted in the Strait of Hormuz, and in any case, there are not enough connections to the oil and gas infrastructure located on the other side to transport the precious commodities across the country. This allowed the Saudis to maintain exports above 4 mb/d during the war thanks to its Yanbu facilities, even though fresh Houthi threats are making this route dangerous too, and add to the volatility.
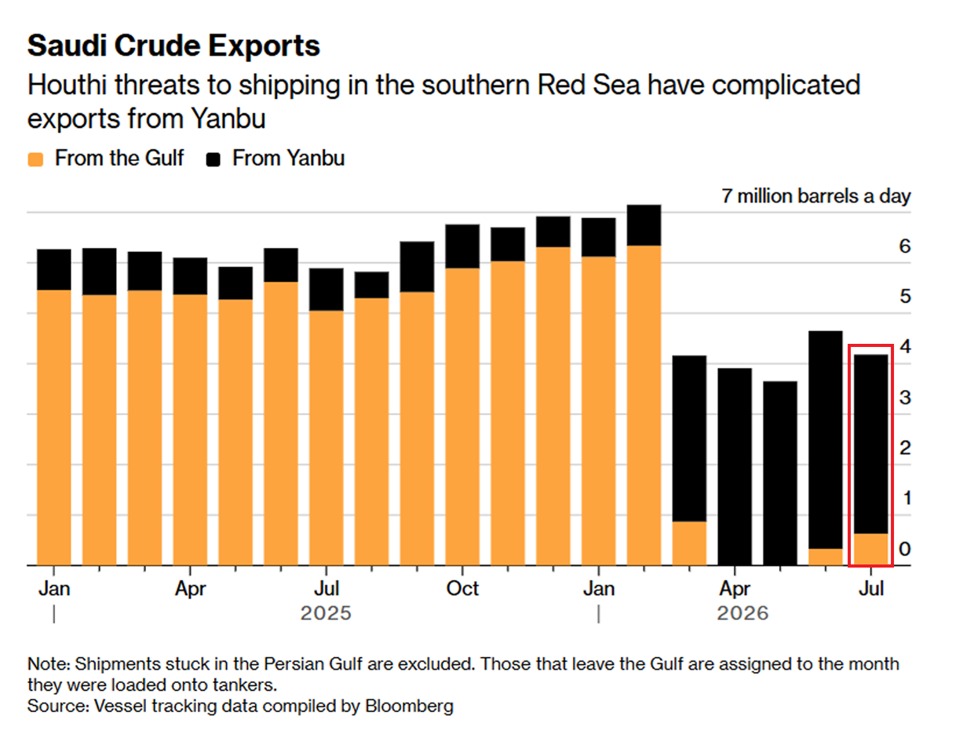
It is no surprise that the crisis has accelerated infrastructure decisions that were previously deemed too costly. The UAE has fast-tracked construction of a second pipeline designed to bypass the Strait entirely, with ADNOC's new West-East Pipeline already approximately 50% complete and targeted for delivery in 2027. Saudi Arabia is re-examining pipeline and port alternatives on the Red Sea. Iraq, almost entirely dependent on Hormuz, is urgently exploring port options via Jordan and Turkey. Projects that seemed marginal before the crisis now look essential.
The Trump Factor
No analysis of this crisis is complete without acknowledging the unusual nature of the political communication surrounding it. Trump announcements have repeatedly confused markets: peace deal imminent, then war escalation, then ceasefire, then resumption of strikes. Just as I started working on this piece, Trump had resumed the strike and a couple of days in my writing, he paused them again.
This creates a volatility that is partly driven by noise rather than substance. Since the beginning of the conflict, markets have gradually learned to apply more caution to these declarations, which are not always followed by action or facts.
This has paradoxically created a kind of false stability: less immediate price response, but an accumulation of unpriced structural tension.
Now, the war benefits the US in many ways. Before the conflict broke out, Brent was trading in the low 70/barrel breakeven for new US oil wells. Below $50-60, drilling activity slows considerably in the US. Higher oil prices benefit US producers and conveniently boost export revenues.
I however do not believe, and no serious analyst does either, that this conflict has anything to do with safeguarding jobs in the US oil and gas sector. This is not a contrarian position: the current US administration is publicly advocating for lower oil prices: White House adviser Peter Navarro released a report claiming that neutralising Iran would eliminate a "terror premium" and drop oil prices below 55 post-war. Energy economist Ed Hirs publicly disputed these claims.
But I think the more likely explanation is simpler: the so-called Operation Epic Fury is yet another ego move. Trump is still chasing his Nobel Peace Prize. The weeks preceding the start of the war saw one of the largest and most intense waves of civil unrest in the history of the Islamic Republic. Therefore, Trump took a (costly and dramatic) bet on growing Iranian public discontent against the regime to deliver a quick win, much like he was convinced of a rapid democratic transition in Venezuela. That hasn't happened either, by the way: the Maduro regime is still in place. Besides, a genuine US victory in Iran (had it materialised) would have meant more Iranian oil on the market with a lift of the sanctions, translating into a downward pressure on prices. The economic logic of launching a war to support oil prices doesn't fully hold.
Part 2: How Oil Markets Actually Work
Crude Oil Is Not One Thing
The first thing to understand about oil markets is that "oil" is not a homogeneous commodity. There are hundreds of different crude grades, varying by density (API gravity) and sulphur content. Light, sweet crude (low density, low sulphur) is easier to refine (i.e. to turn it into a petroleum product) and commands a premium. Heavy, sour crude (high density, high sulphur) requires more complex refining equipment but is cheaper.
The Gulf produces mostly medium to heavy sour crude. The US, through its shale revolution, produces primarily light sweet crude. This means they are not perfect substitutes. When Middle Eastern supply is disrupted, buyers cannot simply call up a US shale producer and order the same product: each refinery is configured for its own slate.
When we talk about oil prices, we usually refer to the two most cited benchmarks: Brent (North Sea crude) and West Texas Intermediate (WTI). Both are priced in the Atlantic basin. They reflect conditions in Europe and the US, which are served by different supply routes and have significant strategic reserve buffers. They are not the same as the oil that Asian refiners buy from the Gulf.
For those who want to understand the sector in depth, the Oil & Gas Industry Operations and Markets course from Duke University on Coursera provides an excellent foundation (free to audit, structured, and taught by practitioners): watching the video without doing the assignment should not take you more than three hours, if you take some notes.
The Regional Price Divergence: The Real Signal
While Brent was hovering around 150 in late March, a record**, according to the Oman Observer. Similarly, Dubai crude reached all-time highs. In the meantime, Norwegian, Algerian, and Kazakhstani crudes achieved extraordinary premiums because their characteristics resembled Gulf crude now trapped behind the Strait.
These prices reflected what economists call marginal scarcity: the price at which desperate Asian refiners were willing to buy to keep their facilities running. Refineries are designed to run 24 hours a day, 365 days a year. Shutting them down and turning them back on involves extreme shifts in temperature, pressure, and fluid dynamics that create significant mechanical and safety hazards.
The apparent stability in Brent and WTI cannot therefore be taken as an accurate picture of the overall market: it accounts in particular for the temporary buffer created by regional inventories and policy intervention.
Should the conflict last longer, I believe we could expect the Atlantic basin benchmarks to eventually converge with the regional reality. More and more Asian refiners may eventually be forced to switch to lighter crude to keep on running their facilities, even though this would lead to operational inefficiencies. This includes the underutilisation of their deep conversion units such as hydrocrackers and delayed cokers. Refineries running lighter crude saw a sharp reduction in residual fuel oil production due to the nature of the feedstock. This is already a reality: ExxonMobil's Jurong Refinery was reported to have started importing light sweet crude, less than a year after having upgraded its facilities to process heavier grade. This is not a single example: two of Singapore's three refineries have declared force majeure on bitumen exports, which requires heavier crude.
This has a direct impact also on the price of petroleum products: jet fuel, diesel, bitumen, and even naphtha are all becoming more expensive as yield at Asian refineries has significantly dropped for these products. In China, state-run facilities were forced into run-cuts and had to aggressively alter their yields, sacrificing the production of naphtha just to maintain the bare minimum transportation fuel supplies required for domestic energy security. As of July 2026, Chinese state-owned refineries are still operating under severe run-cuts.
In my opinion, it is one of the strongest arguments for the view that current prices do not reflect the structural tightness of the market.
Paper Markets vs. Physical Markets
To understand oil pricing fully, we must distinguish between two parallel universes that interact constantly: paper markets and physical markets.
Paper markets, meaning by that futures contracts traded on exchanges like the NYMEX or ICE, allow market participants to buy or sell oil at a fixed price for future delivery. These contracts are predominantly financial instruments. The vast majority of participants are made of hedge funds, banks, institutional investors, who never intend to take physical delivery of a barrel of oil. They use these contracts to speculate on price direction, hedge financial exposure, or arbitrage price differentials. Paper markets provide liquidity and price discovery, but they are driven by financial flows that may not always reflect physical reality.
These are the markets that are often accused of speculating on commodity prices. But speculation is not a bad thing: it is required to have efficient markets. Without these speculators, physical actors such as refiners would be bearing a lot of uncertainties around prices, which would not be compatible with their day-to-day activity. These companies must safeguard margins: they do not want to end up having bought their input at a higher price than they can sell their output for, and processing costs still have to come out of the difference. Most refiners are not willing to be exposed to price risk. These financial instruments allow them to secure a sell price now for a production that will only be available for sale in a few weeks or months. This is what we call hedging.
Physical markets are where actual cargoes of real crude oil change hands. A refinery in Singapore buys a specific grade of crude from a Gulf producer, arranges shipping, and takes delivery at a specific terminal. This market is harder to observe as most trades are bilateral, private, and only partially reported, but it is the bedrock on which paper prices are built.
The two markets interact continuously. When physical barrels become scarce, the front-month futures price rises sharply relative to longer-dated contracts, creating what traders call backwardation. Conversely, when physical supply is ample, longer-dated contracts trade higher than the front month, creating contango, which incentivises storage. In layman terms, if you can sell a barrel for 8 for the year, you're pocketing a profit of $2 per barrel (excluding transportation costs).
Understanding the shape of the futures curve is therefore one of the most important tools for reading the physical market's underlying state.
During the 2026 crisis, the extreme backwardation of the Brent curve, with near-term contracts trading far above those for delivery in six or twelve months, was a reflection that the immediate physical market was acutely tight. This signal was not being properly communicated in the headline Brent price, which remained partly insulated by Atlantic basin buffers: we will come back to these buffers shortly.
The Futures Curve Is Not a Crystal Ball
A few months ago, when US Treasury Secretary Bessent appeared on Fox News pointing to the oil futures curve as evidence that prices would soon return to $80, he was either misunderstanding or misrepresenting how futures markets work. This kind of selective use of market data to support a political narrative is, unfortunately, not uncommon.
The futures curve does not represent what market participants expect oil prices to be at future dates. It represents what buyers and sellers are willing to agree on today for future delivery, based on their immediate hedging needs. This point is fundamental. As we discussed earlier, physical market participants need to lock in prices. Oil producers sell futures contracts to lock in prices for production they expect to pump. Refiners buy futures contracts to fix their input costs. Neither party is making a macroeconomic forecast: they are managing their own risk.
History makes this point forcefully. During the COVID pandemic in April 2020, the futures curve showed oil for delivery two years later at 100, as Russia's invasion of Ukraine triggered a new supply shock.
It is also worth stopping by another hedging instrument available to these actors: options. An option is a derivative contract that grants the buyer the right, but not the obligation, to buy or sell an underlying asset at a specified strike price on or before a set expiration date, in exchange for paying an upfront premium. If I purchase a put option (i.e. a right to sell), I might secure the right to sell you a barrel of oil at 90 at that point in time, I will likely exercise my option, buy a barrel at the lower spot price, and sell it to you at the 96 in six months, I will let the option expire unexercised and simply lose the premium I paid you. This instrument functions as a directional protection.
The options market tells a more honest story about uncertainty. Before the Iran war, options giving traders the right to buy oil at 62 at that time. During the crisis, contracts linked to 200 oil began trading routinely. That is traders buying insurance against scenarios they believe are genuinely possible.
Part 3: The Buffers and Why They Are Running Out
What "Buffer" Means in an Oil Market
The oil market relies on several layers of buffer to absorb supply shocks without immediate price spirals. Understanding these buffers, and recognising how depleted they now are, is essential to understanding why the current price level may be deceptive.
Commercial inventories are stocks held by oil companies, refiners, and traders in tanks and on tankers. These fluctuate constantly as the market absorbs over- or under-supply. Going into the Iran war, OECD industry stocks stood at 2,838 mb (November 2025 data, per IEA's Oil Market Report of January 2026), largely in line with the five-year average level. This cushion was significant.
Strategic petroleum reserves (SPRs) are government-held stockpiles for emergencies. The US SPR is the largest in the world. The IEA coordinates emergency releases among its member countries (which includes most of the Western major advanced economies). During the crisis, Western governments drew on SPRs and released record volumes. By mid-July 2026, the IEA's member countries had released almost three-quarters of a planned 400-million-barrel emergency stock release. There are only a few weeks of planned releases remaining. On August 10, it was reported that crude oil inventories in the US SPR have officially fallen below 300 million barrels for the very first time since 1983.
China followed a similar strategy, the extent of which is more difficult to assess as nobody has a clear view on its inventories: some estimates assessed these reserves to as high as 1.3 to 1.4 billion barrels pre-war (or the equivalent of 130 days of maximised domestic consumption), but this would comprise both strategic and commercial reserves, for a total storage capacity estimated between 1.8 and 2.4 billion barrels. However, the disparity between the material decline in crude import and the forecast decline in local demand only hints at the use of the strategic reserves to offset the impact of high prices.
Floating storage, literally oil held on tankers at sea, is another form of buffer. When land-based storage fills up, traders rent supertankers to store oil at sea, waiting for better prices. The COVID crisis of 2020 provided a stark illustration of what happens when this mechanism runs to its limits. Demand collapsed so suddenly and completely that onshore storage at the US hub of Cushing, Oklahoma reached 83% of working capacity. Unable to take physical delivery, financial holders of the expiring WTI May 2020 futures contract were forced to pay buyers to take the oil off their hands. On 20 April 2020, the WTI front-month contract settled at negative $37.63 per barrel: the first negative oil price in the 37-year history of the contract. At the same time, with onshore tanks full, the world repurposed tankers as floating storage: at the peak, nearly 100 of the world's 800 VLCCs (Very Large Crude Carriers) were being used for offshore storage rather than transport, driving tanker charter rates to extraordinary highs. It was a peculiar inversion: very low crude prices, very high storage and transportation costs simultaneously, driven by the mismatch between financial contracts and physical reality.
During the 2026 crisis, Gulf producers rushed to empty brimming storage tanks during the brief ceasefire period, funnelling millions of barrels through Hormuz to free up space for resumed production. ADNOC alone sold 84 million barrels via tender during this period. With the conflict resuming, all of these buffers were largely exhausted, as reported by a senior commodity trader in the FT earlier this month, despite the IEA reporting that global observed oil inventories in June rose for the first time in four months. But reading the detailed data of that report also shows that onshore storage declined by 96 million barrels and oil on water increased by 117 million barrels: hence a 21 million barrel positive change in inventories, but not really an increase in the buffer.
The tank tops that accumulated during the initial blockades have been drained.
If exports or transit are shut down again, Gulf producers won't have the luxury of storing un-exported crude for long before reaching operational limits and being forced to shut in production.
The latest report available as of today indicates that global observed stocks stand at 8,005 million barrels. That sounds like a lot for an article about depleted buffers. It is, until you keep in mind that physical oil supply chains require a massive baseline of inventory just to operate. This includes pipeline fill, which is the oil required inside thousands of miles of pipelines to maintain operating pressure. But also tank bottoms, i.e. the minimum volumes needed in refinery and terminal tanks to keep pumps running and prevent equipment damage, as well as transit volumes.
This Minimum Operating Inventory (MOI) accounts for roughly 4,800 to 5,200 million barrels globally. If total stocks approach this threshold, physical distribution starts to break down and refineries face forced shutdowns. Therefore, the discretionary buffer (the oil sitting above minimum operational needs and strategic requirements) is far smaller. At the peak drawdown rate in May (-4.6 mb/d), global markets were burning through inventory at a rate of nearly 140 million barrels a month. The 275 million barrel draw between March and May wiped out a massive portion of the world's excess commercial cover in just 90 days.
Besides, these volumes need to be put into the perspective of the global demand: it averages around 103 mb/d. Therefore, the total inventories of 8,000 mb which include, once again, undrawable working stocks and locked strategic reserves, only represent around 77 days of total demand. Industry stocks held in developed economies are the true, flexible market shock absorber and sit well below their 5-year historical average, offering around 55--58 days of forward cover.
China's Destock: The Hidden Variable and the Strategic Logic
The most important single factor containing oil prices during the crisis has been China's behaviour. China became the world's biggest oil importer in 2017. Morgan Stanley estimates that China's seaborne net oil imports fell from approximately 14 mb/d before the war to around 8.5 mb/d during it, a reduction of 5.5 mb/d.
There are a few things at stake here: not all the reduction has to do with the conflict. First, it is worth remembering that the downward pressure on oil prices that was experienced before the war was in part explained by a slower growth in demand from China. The rapid and massive electrification of its car fleet has sharply reduced petrol demand over the past few years.
Second, pre-war low prices had incentivised the Chinese government to build up the strategic reserves. It is estimated that China had been buying around 900,000 barrels each day over the first eight months of 2025 to put into storage. This volume also disappeared, even though it was reported that Chinese buyers purchased as much as 26 million barrels for delivery this summer as prices had fallen down, on top of routine Gulf term purchases of ~5.5 mb/d, further enhanced by Saudis offering steep discounts (-$1.50/bbl on 7 July) to attract Chinese buyers back.
But a large part of the 5.5 million reduction comes from the use of the strategic reserves. This is not simply a refusal to buy expensive oil. It is sophisticated strategic inventory management with multiple objectives operating simultaneously.
Chinese state-trading houses continued to take their contractual allocations from term suppliers but then re-offered those cargoes to spot buyers in the Atlantic basin rather than shipping them east. The practical effect: China was burning through its own reserves, maintaining contractual relationships, and helping bridge the supply gap in global markets.
This is not purely out of generosity: the commodity trading adds another layer to that. Sophisticated traders recognised the opportunity: offtake contracted oil at cheaper term prices, sell it on the spot market at premium prices, build cash reserves, and then return to rebuild strategic inventories once prices have corrected. This is textbook commodity arbitrage: temporal arbitrage on a geopolitical scale.
But there is a second dimension. By drawing on strategic reserves rather than buying at spot prices, China was protecting its national champions, such as state refiners like Sinopec and CNOOC, from paying the elevated market prices that Western and Asian competitors were forced to accept. This matters because it is precisely at this moment that China had lost two of its historically cheapest oil sources: Iranian oil, now cut off, and Venezuelan oil, now redirected to Western markets at market prices following the fall of the Maduro regime. By destocking strategically, China avoided amplifying the very price spike that was hurting its import costs, even though it is worth remembering that Iran and Venezuela accounted for only 14% and 4.5% of Chinese crude imports respectively (likely to be underestimated as some of these imports are recorded as shipments from other countries).
What we can say with confidence is that China cannot sustain the current import reduction indefinitely. It will not allow its reserves to reach zero: we're yet far from it as of July 2026.
When Chinese buyers return to the spot market with full demand, they will be competing against all other buyers for supply that hasn't grown.
The Russian Offset: A Double-Edged Sword
Ukraine's drone strikes on Russian refining infrastructure, which reportedly put up to 60% of Russia's refining capacity out of action, created a paradoxical effect on global energy markets.
Russia, unable to refine its own crude domestically, was forced to export more unprocessed crude oil to China and India. This additional supply on crude markets provided marginal downward pressure on crude prices, helping contain the Brent benchmark.
But the same strikes that increased crude exports also removed Russian products (diesel, jet fuel) from global markets. Russia had been one of the world's largest diesel exporters. European countries, which had already been working to reduce Russian fuel imports following the 2022 invasion, now found themselves competing for alternative supplies with countries like Turkey and Brazil that had continued buying Russian diesel and now needed substitutes.
This explains an important aspect of the crisis: it is not purely a crude oil story but simultaneously a refinery crisis, a diesel crisis, and a jet fuel crisis. When airlines warned earlier this year about potential fuel shortages, they were talking about a specific product, jet kerosene, that is manufactured in refineries, not pumped directly from the ground. Damage to refining capacity (whether in Russia through Ukrainian strikes or in the Gulf through the war) can tighten product markets even when crude supply is technically recoverable.
As per IEA's July report, refined product cracks (i.e. the price difference between a barrel of raw crude oil and the wholesale price of the petroleum products extracted from it) and margins surged to four-year highs, as increased crude supplies pushed prices lower while product markets stayed tight.
The binding constraint has migrated downstream.
Refineries that can source their favourite crude are running at high capacity, as high as 97% across the US. This shows that refiners with the right slate are printing money while the ones without it are cutting runs.
Part 4: The Economics of an Oil Field: Why Not All Barrels Are Equal
We touched on this earlier in this piece, but it is worth its own section. One of the most important concepts for understanding oil market dynamics is the economics of individual oil fields. Not all oil is equally cheap to produce. This cost differential explains much of the geopolitical structure of the energy world.
Technical Breakeven vs. Fiscal Breakeven
There are two very different ways to measure the cost of oil production, and conflating them leads to significant confusion.
The technical breakeven (or lifting cost) is the actual cost of extracting a barrel of oil from an existing well. This is the pure operational cost. For instance, Saudi Arabia's Ghawar field, the world's largest oil field, produces oil at a lifting cost estimated by Rystad Energy at $3-9 per barrel. Why is it that cheap? It's geological: the oil lies close to the surface in enormous reservoirs under natural pressure, requiring minimal energy to lift.
Contrast this with US shale oil (side note: this is not the only type of oil drilled in the US): breakeven prices for new wells in the Permian Basin run around $62 per barrel, and significantly higher in less prolific basins. Shale is a rock with incredibly low permeability, meaning it is solid and dense (if you're a visual person, see it as more like concrete than a sponge). The oil is trapped inside microscopic pores within the rock itself and cannot flow anywhere on its own. To physically force that oil out, engineers use high-pressure fluid injection (and I won't bore you more with technical details). Once the trapped oil is finally free, it flows back up the well. And the complexity goes beyond that, as these wells deplete quickly, forcing the oil operators to constantly drill and frack expensive, brand-new wells. The process is much more complex and costly, leading to a higher lifting cost.
Canada's oil sands require $80+ per barrel. In its natural state, that oil is tightly mixed with sand, water, and clay, meaning it cannot simply be pumped out of a traditional well. The process is therefore even more complex than for shale oil, but worth reading about if you have some time to spare.
Each reserve has its own specificities, requiring its own drilling methods. We only touched on onshore reserves here, but it is equally interesting to get to understand offshore drilling: investigate how jack-up rigs, FPSO, or even Tension Leg Platforms (TLP) work. The oil industry truly pushed innovation far: modern applied seismology, precision drilling mechanics, extreme marine engineering, or even molecular manipulation all benefitted from the R&D invested by oil majors. The sector is actually one of the most technologically advanced and highly capitalised engineering sectors on the planet, because a lot of money is to be made from it.
Let's move on to the next concept: the fiscal breakeven. It is the oil price a country needs to balance its national budget. This concept only applies to the countries with a high reliance on oil and gas to fund their budget. A good example is Saudi Arabia. The Kingdom's fiscal breakeven is estimated by the IMF at approximately $90-100 per barrel.
This is the tension at the heart of Saudi oil policy: the country can technically produce oil at under 90 to fund its government.
This explains why Saudi Arabia cannot simply flood the market at will, even though it could technically do so.
Game theory: how the green paradox has shifted the market?
Applying game theory to global oil markets reveals that the assumption that 'all producers want high prices' is fundamentally flawed. The market is driven by players with entirely different payoff matrices. It is finally time to introduce a core player of the oil markets, the one whose name has been the object of so many headlines: the Organization of the Petroleum Exporting Countries, or OPEC.
You are likely familiar with that name and aware it is, and I am quoting Wikipedia here:
An intergovernmental cartel enabling the co-operation of leading oil-producing and oil-dependent countries in order to collectively influence the global oil market and maximise profit.
Founded in 1960, it was initially made up of five founding members (as self-defined): Iraq, Iran, Kuwait, Saudi Arabia, and Venezuela. It had since then welcomed a few more "full" members: Qatar (1961), Indonesia (1962), Libya (1962), the UAE (1967), Algeria (1969), Nigeria (1971), Ecuador (1973), Gabon (1975), Angola (2007), Equatorial Guinea (2017) and Congo (2018). Not all are still part of OPEC, which today counts 11 members.
In 2016, OPEC signed an agreement with ten other oil-producing countries, creating OPEC+. This was driven by a shared objective to respond to the significant decline in oil prices following the material increase in US shale oil output. Keep that event in mind for now, we will very shortly come back to it.
OPEC+ is the textbook economic example of a repeated Prisoner's Dilemma. To keep prices high, the cartel agrees to mutually restrict output (cooperation). It constantly tempts individual members to cheat. Yet, if every member acts in their own rational self-interest and cheats, the market floods, prices collapse, and everyone loses (mutual defection). Some members had decided in the past to conveniently forget about the gentleman's agreement: Saudi Arabia must occasionally flood the market intentionally (as they did in 2014 and 2020) to punish their own cartel members and force them back into compliance. And sometimes, members just leave. In 2024, Angola left the cartel, following a bitter dispute over its 2024 production quotas. These quotas no longer aligned with Angola's needs or even capabilities.
Where it gets more interesting is that OPEC+ does not include all the major oil producers, the most notorious of them being the US. Because US producers are private companies, they are legally barred from colluding due to antitrust laws, therefore cannot be part of OPEC+. Nothing prevents them from ramping up their own production to capture market share at the newly inflated price without having to cut a single barrel themselves.
Now, many American oil producers are a lot more vulnerable to price drops. Their technical breakeven is rather high, as we've just discussed with shale oil producers. Conversely, sovereign producers in the Middle East have incredibly low technical breakevens but high fiscal breakevens. This asymmetry allows sovereign producers to weaponise their low extraction costs, occasionally launching price wars designed to bankrupt private competitors, relying on their massive cash reserves to absorb the temporary fiscal deficit.
Beyond production costs, the market is dictated by a convoluted game of geopolitical alliances and leverages. Russia, locked out of Western markets by sanctions, is highly vulnerable to the monopsony power of China and India. Knowing they are Moscow's only viable massive-volume buyers, Beijing and New Delhi can force Russian producers to accept steep discounts.
Even within OPEC+, long-term interests are diverging. The UAE, having aggressively diversified its economy, is less reliant on high oil prices and increasingly favours pumping higher volumes (hence a downward pressure on prices) to monetise its reserves before the energy transition accelerates. Saudi Arabia, conversely, requires high oil prices to fund its ambitious Vision 2030 diversification projects, though Riyadh maintains the strategic flexibility to delay these megaprojects if forced to engage in a battle for market share or, as it is the case now, to adapt to adverse market conditions. This divergence has led to something that would have been unthinkable a few years ago: the UAE officially withdrew from OPEC and OPEC+, effective 1 May 2026. The driver was a quota dispute with Saudi Arabia. The UAE wanted an allocation matching its ~5 mb/d capacity by 2027, built on roughly $150bn of investment, well above the quota of c. 3.2 mb/d granted by OPEC. This was not aligned with the priorities from Riyadh: price stability and higher prices to sustain their astronomic investments into Vision 2030.
This decision illustrates a fundamental shift in the market: the global transition away from fossil fuels has changed the time horizon of the oil market. Historically, producers believed oil demand would grow forever, making it rational to leave oil in the ground because it would always be valuable tomorrow. As peak oil demand approaches due to electrification and climate policy, the game now has a terminal horizon. This creates a "run on the bank" dynamic. If a sovereign producer believes their underground reserves will be worthless or heavily taxed in 30 years, their rational dominant strategy shifts: they are incentivised to pump and sell as much as possible right now, even at lower prices, before the music stops.
This is a medium-term bear case sitting underneath a short-term bull case.
So next time you read or hear about OPEC+ countries having agreed on raising or declining their output, you may want to look at it through these lenses: it makes the story a lot more compelling.
This cost structure explains the fundamental power of Gulf producers in global oil markets. When oil trades at 65, it is losing money at the fiscal level but can still profitably produce and sell every barrel: it simply draws down reserves or borrows. When oil trades at $40, US shale producers start shutting in wells because production costs exceed revenue. Saudi Arabia continues producing.
US Shale: Who Sets the Floor
The shale revolution fundamentally changed the economics of global oil markets. By 2019, the US had become a net oil exporter --- a status it had not held since the 1970s. This gave the US energy independence that was unimaginable twenty years earlier.
But it also created a structural constraint. US shale producers need oil above roughly 65-71 per barrel --- dangerously close to the threshold where large numbers of US shale operators become marginal.
Trump's stated ambition of returning oil to 55, well economics deteriorate severely across most shale basins. Exploration programmes are cut. New production growth stops. Within six to twelve months, overall US production would begin declining. The market mechanism is brutal and automatic: too low a price reduces supply, which pushes the price back up. But the transition period --- with bankruptcies, job losses, and investment collapses --- is genuinely damaging.
I am singling Middle Eastern and American producers out because they sit at opposite ends of the cost curve and between them set the ceiling and the floor. Russia, Canada, Brazil and Guyana (and many others) matter to the supply picture and I come back to them later.
The Two Clocks paradox
The oil markets appear to be running on two separate clocks now. On a first clock, it shows warning signals of tightness. Buffers are gone all around the world. Regional benchmarks are trading at extraordinary premiums. Cracks just hit a four-year high. And OPEC+ effective spare capacity lies at 0.04 mb/d, most of which loads inside the Strait: in other terms, functionally zero. These are all bullish signals for oil prices, supporting the thesis that the market is currently mispriced.
I would further highlight that even in case of a reopening of the Strait, we shall not expect all the oil to flow through as it used to from day one. Several reasons to that. Firstly, Iranians are currently pushing for the control of the Strait, which would suggest the creation of a tolling fee (yet unresolved, because Iran is demanding 5-7% of cargo value, while Oman is proposing around 3%), traffic control and monitoring, and the ban of American and Israeli ships (with fines up to 20% of cargo value for violators). This will slow transit velocity, reduce effective global fleet capacity, and must therefore be priced in.
Iran's deputy foreign minister, Kazem Gharibabadi, said the arrangement would be temporary, two to four months, with a significant portion of traffic passing through Iranian territorial waters, and explicitly that it "does not mean the full reopening of the Strait". Iran's security chief added that the strait will not reopen until the US ends military action and lifts sanctions. Yet, the paper market repriced 7% lower in a week on a headline, while the actual arrangement on the table is temporary, partial, conditional and unsigned... leading to another roller coaster event on 10 August with oil prices up 5% in a few hours as the US President is now demanding compensation from Iran while Iranians claim that the Strait will stay closed until the end of Trump's mandate.
One thing seems to become more likely every new day: there will be a new regional order post this war.
Secondly, both the US-Israeli strikes on Iran and the Iranian counter-strikes across the Gulf have caused substantial damage to energy infrastructure. Iranian petrochemical plants, steel facilities, gas production at South Pars, and export terminals have been hit. Gulf infrastructure has faced repeated attacks.
The damage will not be repaired overnight. I have financed greenfield infrastructure in this sector, and I can tell you that projects involving major equipment with 40-50 month lead times, complex engineering, and multiple regulatory approvals do not spring back quickly even with unlimited funding. The physical infrastructure of energy production (refineries, terminals, processing plants, pipelines) is not like a factory that can be restarted with a key. It requires specialist equipment, certified operators, safety certifications, and in many cases complete replacement of major components. Hydrocarbon infrastructure exposed to fire, pressure shocks, or structural damage cannot be re-pressurised without exhaustive non-destructive testing (NDT), hydro-testing, and safety recertification.
ADNOC's chief executive Sultan al-Jaber estimated at an Atlantic Council event on 21 May 2026 that even if the conflict ended that day, it would take at least four months to restore 80% of pre-conflict flows, with full recovery not expected before the first or second quarter of 2027. Given that the conflict has carried on for already three additional months, these timelines are now optimistic.
Thirdly, the mining of the Strait adds another layer of complexity. Demining operations are slow, dangerous, and technically challenging. Even after a peace agreement, the presence of mines in the waterway could make transits dangerous and expensive, requiring extensive sweeping operations that take months. And the mere suspicion of mines would drive up insurance costs dramatically for any vessel attempting transit.
Beyond mines, the Joint War Committee (JWC, an influential body representing marine hull war underwriters) and Protection & Indemnity Clubs (P&I, non-profit mutual insurance associations owned and governed directly by shipowners and charterers) will not remove high-risk designations immediately. The resulting war-risk insurance surcharges, which can add 7 per barrel equivalent in shipping freight, act as a persistent de facto tax on transit.
All these elements add up to the thesis that the short-term oil market is not a cheap one.
Conversely, looking at the other clock, we are facing a structurally loosening market with major oil producers willing to cash out on their reserves while oil is still in high demand. OPEC+ is raising output for a sixth consecutive month and the UAE is now out of it and can now set its own production pace. With Venezuela back in the market and a potential comeback of Iran, which is pushing for sanctions relief as a condition to a peace agreement, and not even mentioning the large prospects in Guyana and Brazil, oil supply has never been that high... while many serious forecasts now anticipate that demand growth has peaked, largely driven by energy transition.
Under the base-case transition scenario of IEA STEPS, global oil demand is projected to reach a structural plateau near 105.5 mb/d before 2030, after which net annual growth turns flat to negative. On the other end, WEO 2025's Current Policies scenario has demand rising to 105 mb/d by 2035 and 113 mb/d by 2050, with no peak at all...
Today, the IEA, in its Global Energy Review, estimates that over 60% of daily oil consumption goes to transportation and ~30% to petrochemicals and heavy industry, making electricity generation an insignificant source of global oil demand. The share of global electricity generation from oil has been divided by two in ten years and stood at 2.2-2.5% at the end of 2025. Oil-fired electricity is now largely confined to isolated grids (e.g., small island nations), emergency backup generation, or oil-producing states (like Saudi Arabia and Iraq), though even Gulf producers are actively replacing crude-fired generation with natural gas and solar.
Transportation is also transitioning rapidly, especially land transportation. Global EV sales share (passenger cars) grew from under 3% in 2019 to approximately 25% of new car sales globally. Anyone who has visited China recently can only be impressed by the omnipresence of EVs all over the country: they represent over 50% of monthly domestic car sales. Smaller developed countries such as Norway are almost exclusively selling EVs (97% share in Norway), but it is fair to say that these countries transitioning alone won't move the needle of global warming.
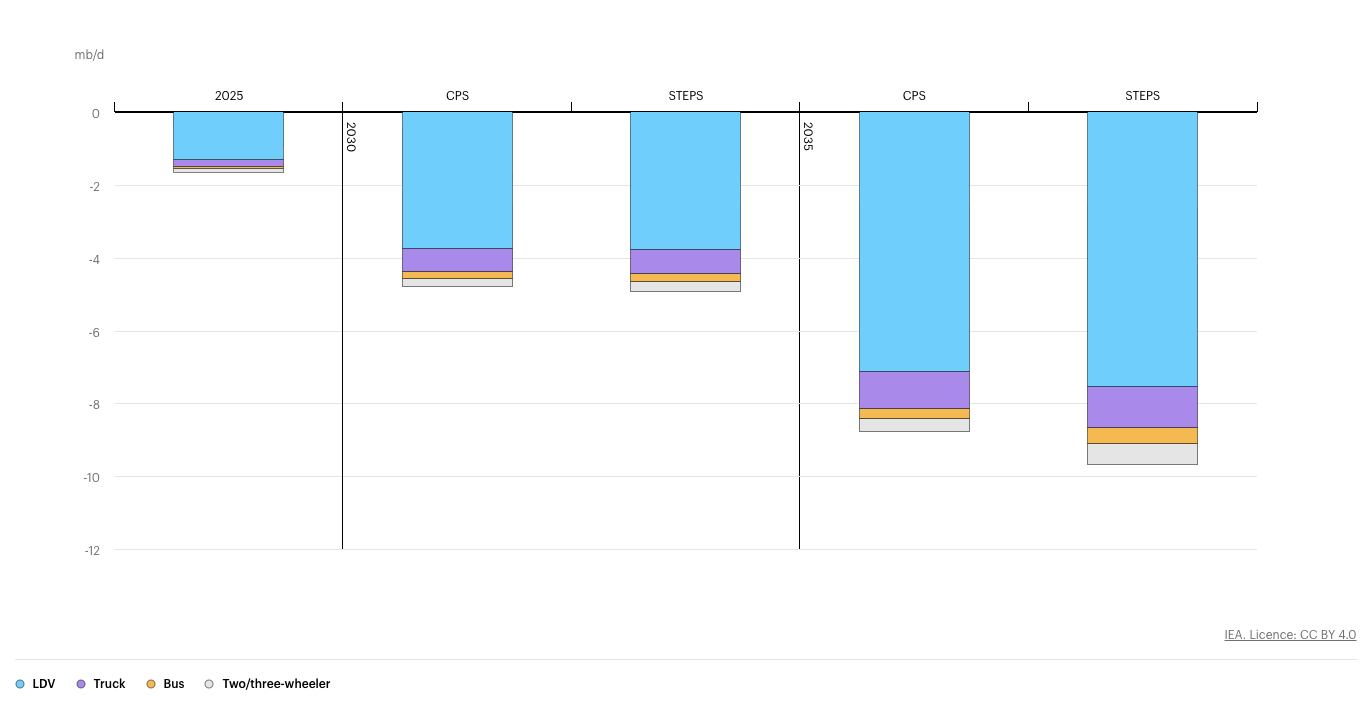
Thankfully, the trend is positive and, globally, electric transport, including 2/3-wheelers, passenger cars, buses, and commercial trucks, is already displacing close to 1.7 mb/d of refined road fuels (gasoline and diesel) every day. Projections indicate that the widespread adoption of passenger EVs in China, Europe, and emerging economies will displace c.5 mb/d by 2030, and as much as 8.5 to 10 mb/d by 2035 under IEA's CPS and STEPS projections where EVs represent over 50% of global new vehicle sales.
Sea transportation still lags behind, even though more and more ships now run on LNG, to the point that it is today the dominant mainstream strategy for shipping decarbonisation. While most of the fleet currently on sea still sail thanks to conventional heavy fuel oil, LNG-powered vessels represent over 50% of all alternative-fuelled ships on order. As of mid-2026, there are nearly 1,000 LNG-powered vessels on order, to add to a current fleet of 800 LNG-fuelled ships, according to the figures from SEA-LNG. No surprise that most of the shipping financings I do nowadays relate to LNG-fuelled vessels. I also note the first faltering steps of an old technology that is being reinvented: the wind sails.
Air transportation is however less likely to contribute to the lesser global demand for oil over the medium term. As of today, aviation alone accounts for roughly 7% to 8% of global daily liquid oil demand (consuming around 7.8 to 8.0 mb/d of Jet A/A-1 kerosene). But it is only a beginning: it is projected to be one of the fastest-growing sources of liquid fuel demand over the next two decades, driven by expanding middle classes and rising passenger air travel in non-OECD Asia.
Equally, petrochemicals and heavy industries are acting as the primary structural engine of global oil demand growth. Petrochemicals currently account for roughly 16% of total global oil consumption (~16.5 million barrels per day) and are expected to account for more than a third of the oil demand growth by 2030 according to the IEA. The IEA projects this will rise to 17.4% by 2030 (~18.4 mb/d). From 2019 to 2024, over 95% of net global oil demand growth came from petrochemical feedstocks. Between now and 2030, petrochemicals are projected to add another 2.1 mb/d of oil demand. This is directly linked to the growing demand for materials (plastics, clothing, construction).
Funnily enough, energy transition is in part responsible for some of this growth: solar panel backsheets drive strong net demand growth for virgin naphtha (alongside other products, naturally). It is worth noting that heavy industries are slowly substituting oil-fired boilers with natural gas or industrial electrification, but the transition is capital-intensive and slow.
As a consequence of the lower expected demand for fuel but increasing one for petrochemicals, energy companies like Saudi Aramco, Sinopec, and ExxonMobil are actively building Crude-to-Chemicals (COTC) refineries designed to turn up to 70% of a barrel of crude directly into chemical feedstocks rather than motor fuels.
The medium-to-long-term outlook (2027--2035) leans distinctly bearish on structural market fundamentals. The market is shifting from a period defined by supply tightness and geopolitical risk premiums toward an era dominated by a growing capacity overhang and decelerating demand growth.
The big yet unanswered question is therefore: which clock will win in 2027?
The short term one due to an expansion of the conflict or the longer term one with a quick resolution later this month. Financial paper markets are trading on macro headlines and diplomatic sentiment, while physical supply chains are bound by the unyielding rules of engineering and naval logistics. This two-clocks framework is the exact lens needed to understand why paper oil prices remain artificially depressed relative to physical market tightness. The paper markets tend to price geopolitical resolution as a binary "on/off switch", de facto assuming a ceasefire headline instantly restores physical supply.
Part 5: Shutting In a Well, and Why Supply Does Not Come Back
This brings us to one of the least understood aspects of oil markets: the mechanics of shutting in a well, and restarting it.
Reducing production sounds simple: you just need to turn down the valve. But the decision to fully shut in a well, meaning stopping production entirely, is one that oil companies resist with determination, because the costs and complications of restarting are substantial. We discussed how difficult it was for refineries to do so earlier: this can be even more complex for oil drilling.
Let's start with the beginning: drilling
Oil drilling is a continuous interaction with a complex natural system. As we hinted before, an oil reservoir is not a giant underground cavern. It is rather solid rock (like sandstone or limestone) with microscopic pores holding fluid under immense pressure.
The concept of drilling is rather straightforward: we dig a huge hole down the earth. Said like that, it sounds trivial. Yet, it is the exact opposite as drilling goes down several kilometres beneath the surface, penetrating different more or less porous layers. I must admit I only had a rough idea of what's going on down there, so I watched a very instructive and graphic video from the channel LifeAda. The next paragraphs are my attempt to summarise it for you, in less detail.
We dig a first large hole, the wellbore. Then we keep digging from there. Along the way down, casing must be created to ensure no water or soil enter the well but also to preserve the structural integrity of the system. Casing is made of an external layer of cement, while the internal casing, actually inserted first, is made out of a steel pipe. This is replicated several times, yet at different stages of the drilling process, ending up with several layers alternating cement and steel.
This is relatively easy to picture going down vertically. But how on earth do they manage to drill horizontally, and why would they need to do so? The drill simply starts moving at a low angle (3 degrees), resulting in a limited curvature which can be embraced by the steel casing (while cement can flow wherever) without too much structural tension. Over a long distance, this turns into a horizontal hole, allowing the well to reach areas much further from the wellhead: a drainage area of up to 20 km^2^. Before this technique was invented, multiple wells were required to drain that same area. Horizontal drilling is far more economical.
Once the actual drilling phase has completed, we're left with a hole in the ground, protected by several casing layers: oil cannot get in the well. A perforation gun is thus sent down the hole at the depth where oil can be found. Multiple small explosive charges are exploded to go through the casing and create tunnels to the oil reservoir.
Two things can happen: either the natural pressure of the reservoir is enough for the oil to rise on its own, or it has to be pumped. In that latter case, we all have the image of a pumpjack or more commonly known as a "nodding donkey" in our mind. For French or Belgian readers, you will find a good illustration in Tintin Au Pays de l'Or Noir. For the (older) geeks amongst you, my favourite representation remains the one in Transport Tycoon.
This is a very simplified version. There are many other steps along the way, many factors to manage, including the cooling of the drill or the prevention of blowout, which I did not spend time detailing here. If that part is of greater interest to you, I curated a list of resources, available at the end of this article.
Shutting in is quick. Restarting is not.
Our oil is now flowing up, great. But can a well be shut in if oil prices are not economically sustainable? Yes, but a cascade of physical problems can begin. Of note, this could also be required for maintenance.
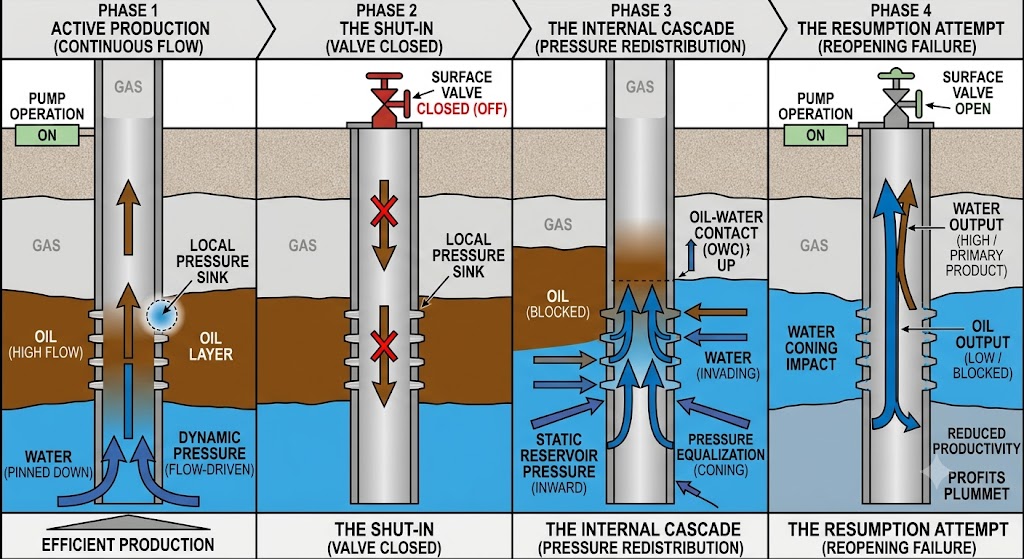
Two types of valves are used to shut in the well. At the surface, an assembly of valves, spools, gauges and pipes, called the Christmas tree, is controlling the flow of oil. To execute a basic shut-in, operators simply close the primary valves on this tree. The oil stops flowing as it has nowhere to go. But there is an issue with that: the immense pressure is now trapped inside the well. This is dangerous: any damage to the Christmas tree could lead to a full blowout of the well.
To prevent this, wells are equipped with a downhole safety valve located underground inside the pipe, working just like a flapper door. The valve is held open by pressure. A drop in pressure automatically closes the valve. This physically blocks the oil underground.
This solution is however not a long-term one. This works well for short maintenance or in case of emergency. If a well needs a longer shut in (several months), operators will bring in a wireline truck (a crane with a long steel cable) and lower a mechanical packer or plug deep down into the wellbore. This is essentially a heavy rubber and steel cork. Once it reaches the desired depth, it expands outward, gripping the inside of the steel pipe and creating a permanent, physical blockade above the oil layer.
In some instances, the well can even be killed, as we say, meaning that it is filled with a "kill" fluid, usually heavy drilling mud. The weight of this heavy liquid column acts like a liquid lid, pushing down harder than the oil is pushing up, temporarily "killing" the well's ability to flow.
Restarting the well means reversing the operations made to shut it in. If it was only valved off, it is rather straightforward with pressure being slowly bled off. If it was set with a plug underground, it takes a bit longer with the use of specialised retrieving tools to remove that plug. It gets eventually a lot more complicated if the well has been killed: the natural pressure is no longer enough to lift the massive liquid column that has filled the pipe: an artificial lift is required. Two methods are commonly used: nitrogen lift (mixing nitrogen to the heavy liquid to make it lighter and allow the natural pressure to take over), or swabbing (taking part of the fluid out, one stroke at a time, until the pressure of the reservoir takes over). This latter technique is literally comparable to bailing a boat: you'd remove one bucket of water at a time, until the boat starts floating again: the boat's natural buoyancy has become stronger than the remaining weight.
This does not seem too bad then to shut in a well. True, it works quite well when a well has not been shut in for too long.
But when operations are down for a few months, physics and chemistry laws take over.
Down there, the reservoir pressure redistributes over time: if the well remains shut in for too long, water from surrounding rock can invade the microscopic rock pores that were previously filled with oil, reducing productivity when the well is reopened. Even if the engineering team executes the mechanical restart flawlessly, getting the oil to flow again is never guaranteed.
Besides, when the flow stops, the fluid stagnates, and the intense heat from deep underground dissipates. Crude oil is filled with heavy organic compounds: under high heat, these compounds are melted and dissolved within the fluid. When it cools down, the fluid structure breaks down and creates some kind of a wax that can clog the wellbore.
In the Middle East, reservoirs often produce sour gas, a combination of natural gas and Hydrogen Sulphide (H2S). When the well is shut in, this gas interacts with the pools of water next to the steel pipe, creating a highly corrosive acid, which corrodes the well casing, pipelines, and surface valves. We call this hydrogen sulphide embrittlement.
All of that means that shutting in a well can lead to permanent damage: a well that was producing 1,000 barrels of pure oil a day before the shut-in is now producing 800 barrels of water and only 200 barrels of oil. This is economically catastrophic and difficult to prevent and anticipate. For offshore production, the challenges are even greater. When flow stops through subsea pipelines, hydrates can form and block them completely. Restarting an offshore platform that has been shut for several months can require intervention vessels, chemical injection programmes, and significant engineering work before a single barrel flows.
The decision of shutting in a well is never an easy one. Restart typically requires capital investment. Therefore, producers resist shutting in wells for as long as possible, accepting near-breakeven economics rather than facing the costs and risks of restart. When they do shut in, the restart of production, when prices recover, takes months.
This creates the characteristic overshooting behaviour of oil markets: prices fall further than they "should" because producers keep producing even below breakeven, then recover sharply when the lag in restoring curtailed production becomes apparent.
Part 6: The Macroeconomic Stakes
A More Oil-Efficient World --- But Not Oil-Independent
One nuance that needs to be acknowledged is that the world in 2026 is meaningfully less dependent on oil than it was in 1973 or 2008. The shift to renewable energy has reduced oil's share of electricity generation. Electric vehicles are beginning to make meaningful inroads into transport fuel demand.
Besides, the oil flows are also very different from these times: the shale revolution reduced Western dependence on Gulf imports. The US has indeed become a net exporter of oil, a status it did not achieve until 2019.
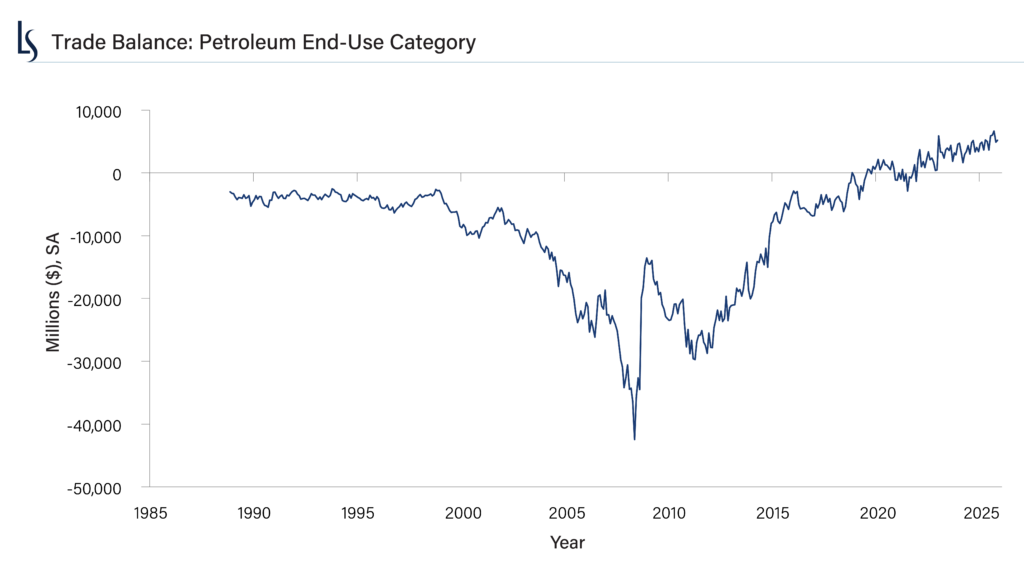
This fundamentally changes the economics of an oil price shock for the US economy. Higher oil prices benefit US domestic producers and boost export revenues, partially offsetting the impact on consumers and energy-intensive industries. This dynamic did not exist during the previous oil shocks.
Historical analysis by the ratio of oil spend to GDP supports this. Eco3min Research, in work first published in April 2026 and updated in July, puts the recession threshold at roughly 4% of GDP: every completed shock above that line was followed by a recession. The 1979 Iranian Revolution took the US oil burden to 8.65% in 1980. The 2008 peak reached 6.47%. The 1990 Gulf War came in at 3.70%, the 2022 Ukraine war at 3.31%. Measured at April's intraday peak of $126.41 a barrel, the 2026 shock sits at 2.76%: comfortably under the line, and under every shock that broke something. The picture is more concerning for Europe and Japan, which remain significant net energy importers.
The Stagflation Dilemma
The scenario that most concerns economists is not a simple recession, but stagflation. Stagflation is the combination of high inflation and low growth that characterised the 1970s oil shocks and proved so difficult to resolve.
A supply shock like a prolonged oil price spike raises costs for virtually every sector of the economy, pushing inflation higher. At the same time, higher energy costs reduce disposable income and corporate margins, slowing growth. > The central bank faces an impossible choice: raise rates to fight inflation, at the cost of further suppressing growth; or cut rates to support growth, at the cost of fuelling more inflation.
This dilemma is particularly acute given the state of corporate balance sheets. Global corporate borrowing, fuelled heavily by AI investments and clean energy sectors, reached record levels in 2025 (in real terms), surpassing even the pandemic peak of 2021. Much of this debt was taken on when rates were near zero; it is now being refinanced at materially higher rates. Many companies that appeared solvent under low interest rates are now stressed. A sharp rise in energy costs, layered on top of higher debt service costs, is a difficult combination for highly leveraged businesses. We are not in the world of 2008, where rates were at emergency lows and balance sheets had room to absorb shocks. We are in a world where the conventional monetary policy tools are already constrained.
I am not a macroeconomist, my professional background is in structuring financings, not forecasting GDP. But the structural argument seems clear: Oxford Economics sets the threshold for mild European recession at roughly 140 a barrel sustained for two months. At **126 was an intraday touch, not two months sustained, which is why nothing broke.
The Energy Transition Accelerator
Supply shocks of this magnitude historically accelerate investment in alternative energy. The 1970s oil shocks drove massive investment in nuclear power and energy efficiency. The 2022 Russia-Ukraine crisis accelerated European investment in LNG import terminals, solar, and wind.
The 2026 crisis will likely have similar effects and will highlight the different perspectives between importing and exporting countries, yet both driven by the same survival instinct. On one end, oil and gas importers will continue their quest towards a less oil-reliant economy, accelerating on their alternative energy investment plans to secure long-term supply. Countries that have been slow to invest in energy efficiency or electrification may find political support for those investments suddenly much easier to obtain.
On the other end, exporting nations accelerate alternative infrastructure to secure their immediate economic survival, directly linked to oil and gas exports. Gulf countries are now seriously considering, when not accelerating, investments in new pipelines and ports that bypass the Strait of Hormuz, which seemed economically marginal before the crisis but now look essential. Analysts at Goldman Sachs recently estimated that there are currently seven new pipeline projects under discussion in the Middle East. If completed by the end of 2028, these new routes could carry approximately 14 million barrels per day, that previously moved through the Strait of Hormuz to bypass it entirely.
Part 7: Gas --- A Crisis Within the Crisis
Why LNG Matters as Much as Oil
The oil market crisis is running in parallel with a gas market crisis that has received less public attention but may ultimately have more severe consequences for Europe. This lack of attention reflects a characteristic of the gas market: it is regionally segmented by pipeline networks and LNG liquefaction capacity. In the US, barely any newspapers covered the natural gas crisis because major US media outlets focus heavily on home markets: there is no such crisis in the US. European (TTF) and Asian (JKM) spot gas prices surged whereas US domestic natural gas (Henry Hub) remained relatively insulated. This is very different to oil, for which a supply bottleneck in the Strait of Hormuz instantly reprices crude futures worldwide in real time.
European gas prices surged nearly 50% since late June 2026, reaching €61.8 per megawatt hour on the TTF benchmark on 10 August, close to the peaks seen in the early days of the conflict, and 87% higher year on year. UK gas prices rose by a similar amount. By contrast, Brent crude rose about 20% over the same period.
The divergence reflects the specific vulnerability of European gas markets. Europe has been steadily rebuilding its gas import infrastructure since Russia's 2022 invasion. It has built new LNG import terminals, diversified its supplier base, and reduced consumption by roughly 20%. But it remains heavily dependent on LNG imports from Qatar, and Qatar, like other Gulf producers, exports through the Strait of Hormuz.
The Storage Problem
In normal years, Europe uses the summer months, when heating demand is low, to rebuild its gas reserves ahead of the winter. The target under EU emergency regulations is to reach 80% of storage capacity by 1 November (relaxed from the normal 90% target).
Equinor, Norway's state energy company and Europe's largest gas supplier, warned in July that Europe might fail to reach its storage targets before winter. France received its lowest monthly LNG cargo count (only 13, well below the 2023-25 August average of 24) in more than five years. Several cargoes scheduled for European delivery in August (of which eight just for France) have been diverted to Asian buyers willing to pay higher prices.
As of early August 2026, EU gas storage stood at approximately 57.9%, some 15 percentage points below the five-year seasonal norm. Germany, Europe's largest gas consumer, was at approximately 46.5%, the lowest level for this time of year since the 2021/22 energy crisis. It would appear that injections are now running slightly ahead of the pace needed for 80% by 1 November, but everything can happen as we've seen before.
Therefore, the winter risk remains real. Total European underground gas storage capacity is approximately 100 to 110 billion cubic metres (bcm) (˜1,100 TWh). During peak winter heating months (December through February), pipeline imports and LNG regasification terminals operate near 100% capacity. Any extra demand caused by cold snaps must be supplied by underground storage withdrawals. Under normal cold conditions, the European Network of Transmission System Operators for Gas estimates in its Summer Supply Outlook 2026 that storage withdrawal rates run around 0.18 to 0.25 bcm/d, but this expands to 0.35 bcm/d or higher under severe freeze conditions. Therefore, every 5 percentage point shortfall in November gas storage reduces the supply buffer by roughly 2-4 weeks at peak winter demand rates.
Not meeting the gas storage target by November will force utilities into panic purchases of LNG vessels on the spot markets, at much higher prices.
Inflation around the corner
While oil prices have a quasi-immediate impact on the household's bills and is visible each week at the petrol station, gas prices are not in the mind of the consumers despite having a greater impact on their day-to-day purchases. Heavy industries across Europe and the UK (steel, glass, and chemicals) are highly reliant on gas to operate and were forced to impose surcharges of their own, sometimes as high as 30%, to cover power and feedstock costs.
Another less known impact relates to food security. Natural gas and fertilisers are closely tied: gas is the primary chemical input to produce fertilisers, on top of acting as fuel. Natural gas accounts for 70% to 90% of the cash cost of producing a tonne of ammonia.
Consequently, many fertiliser production units are in the Middle East, with c. 25% of global urea (a nitrogen fertiliser) trades originate in or pass through the Persian Gulf. Force majeure on Qatari LNG and fertiliser exports drove global fertiliser prices up by over 30%, spiking input costs for key staple crops (such as corn and wheat). Urea specifically is up about 60% for the year and rose roughly 80% between February and April 2026 to above $850/mt.
Synthetic nitrogen fertiliser supports roughly 50% of global food production. The current situation is reviving global food inflation. Farmers are facing a tough choice. They will either sell their crop at a higher price to reflect higher inputs. Or they will reduce the use of fertilisers, meaning they accept lower yields. And lower yields translate into smaller harvests, contributing to smaller supply therefore higher prices.
Attacks and shutdowns at Qatar's Ras Laffan industrial complex also disrupted roughly a third of the world's helium supply, with spot prices up 40-100% within weeks. This creates severe upstream bottlenecks for semiconductor chip fabrication (powering AI hardware) and medical MRI systems. South Korea sourced about 65% of its helium from Qatar in 2025 and Taiwan about 69% from the GCC. Samsung holds roughly six months of stock. As an MRI system needs 1,500 to 2,000 litres of liquid helium, hospitals have had to choose which machines stay running.
Part 8: The World of Commodity Traders
A Business as Old as Civilisation
Before examining how commodity traders function in today's oil markets, let's take a step back and remember that their fundamental raison d'être is not a modern innovation. I did not say that they do not innovate, I simply wrote that they did not appear with globalisation. It is one of the oldest business models in human history, even though they've evolved alongside the world.
Resources have never been distributed equitably across the world, whether due to geology, climate, or accident of history. Someone in northern Europe had grain but not spices; someone in South Asia had pepper but not wool. The merchant who was willing to take the risk of moving a resource from where it was abundant to where it was scarce, buying it cheaply in one place and selling it dearly in another, was creating genuine economic value. Especially centuries ago, when it was not only time-consuming but also dangerous to sail or travel over such long distances. This is what commodity traders do. The East India Company, founded in 1600, was doing exactly this with pepper, ginger, and turmeric from South India. The Venetian merchants who dominated the Mediterranean spice trade in the 15th century were doing it. The Silk Road traders were doing it centuries earlier.
And today, Trafigura, Vitol, Glencore, and so on, are all repeating history. What has changed is scale, speed, and complexity. Globalisation has dramatically expanded both the geographic reach of commodity markets and the financial instruments available to manage risk. Today's oil trading firms move millions of barrels across thousands of miles, hedging their exposures in multiple financial markets simultaneously and running information networks that would have been unimaginable to any historical merchant. But the underlying logic is unchanged:
Buy where or when it's cheap, sell where or when it's expensive, manage the risk in between.
The best single introduction to the modern version of this world is The World for Sale by Javier Blas and Jack Farchy (Oxford University Press, 2021). It won the FT Business Book Award and reads more like a thriller than a financial textbook. For the deeper history and a case study in how these firms can slide from legitimate arbitrage into legally ambiguous territory, The King of Oil by Daniel Ammann (Macmillan, 2009) is the biography of Marc Rich, the founder of Glencore who invented many of the structures these firms still use. Metal Men by A. Craig Copetas offers a more critical perspective on the same story and period. Despite not being a massive non-fiction reader, I genuinely enjoyed all three.
What Commodity Traders Actually Do
The core function of a commodity trading firm is spatial and temporal arbitrage. Physical traders exploit price differences between locations: if Azeri crude is cheaper in the Black Sea than in Europe, and transportation costs are low enough, buying in the Black Sea and selling in Europe generates a margin. They also exploit temporal differences: buying oil cheaply when prices are low (contango market), storing it, and selling it when prices are higher. And often, a combination of the two.
Historically, commodity trading firms operated on an essentially asset-light model. Their competitive advantage lay not in owning infrastructure, but in their information, their relationships with producers and buyers, their ability to arrange logistics through third parties, and their willingness to go where nobody else dared go. The classic commodity traders rented storage, chartered tankers, and kept their own balance sheet as lean as possible.
Over the past 15-20 years, however, a significant shift has occurred. The largest trading houses have increasingly moved toward owning physical infrastructure: storage terminals, refineries, and port facilities. Vitol owns the Fujairah refinery and storage complex in the UAE. Trafigura has invested heavily in terminals and storage globally. Glencore, of course, also owns mines. This asset ownership serves two purposes: it reduces dependence on third-party logistics and pricing, and it generates additional revenue streams from third-party use.
But, and this is important, physical asset ownership is not a prerequisite for successful commodity trading. Plenty of trading firms with minimal physical assets remain highly competitive, because information has always been the more fundamental edge. A firm that understands developing weather patterns before the market (sophisticated proprietary meteorological models are common at large trading houses), or that has early intelligence on a refinery outage in a remote location, or that has long-cultivated relationships with producers willing to share forward production plans, can trade effectively without owning a single storage tank.
In the 2026 crisis, this informational edge was particularly valuable. Traders who understood early that the Hormuz closure would be prolonged, who had good intelligence on the state of floating storage in the Gulf, and who were tracking Chinese import data closely had a significant advantage over those relying purely on public information. And for sure, all have algorithms analysing within milliseconds after a new post from Trump on his various social media.
For an academic treatment of how commodity trading firms create economic value, the freely available The Economics of Commodity Trading Firms by Craig Pirrong is rigorous and accessible: he interviewed traders, operational staff, and senior management at Trafigura to write this book.
The Role of Traders in Crisis Periods
When supply chains are disrupted, commodity trading firms become essential. Their speed and flexibility allow them to redirect cargoes that state-owned companies and publicly listed corporations, constrained by bureaucratic processes, regulatory requirements, and reputational considerations, cannot move quickly enough to redirect.
During the 2022 Ukraine crisis, it was largely commodity trading firms that redirected global LNG cargoes from lower-priced markets to energy-starved Europe, providing a critical supply bridge. The IEA acknowledged that the rapid reorientation of global LNG flows that prevented total energy system failures in Europe during the winter of 2022 was in large part attributable to commodity traders.
More generally, volatility is where these companies shine but also record their highest profits. The conflict in Iran has been a bonanza, with some of the most volatile days of the past 25 years in the oil market having occurred during the months of March and April 2026. A good illustration of that is provided by TotalEnergies, the French energy major, who reaped profits estimated at over $1 billion thanks to an intrepid series of trades: in March, its traders purchased every single cargo (70 in total, more than double February's purchases) of crude produced in Oman and the UAE to load in May.
In the 2026 crisis, many other traders are realising huge profits thanks to record volumes being traded. This is not a coincidence. Commodity markets need these firms precisely when they are most volatile: the dislocations between regional markets during a crisis are exactly the arbitrage opportunities that commodity traders exist to exploit.
This pattern is well established. However, if the risk is not well managed, trades can also go south. During the initial uncertainty in the 2022 Ukraine crisis, some firms recorded massive losses after being caught on the wrong side of sudden moves. The same occurred at the inception of the conflict in Iran: collectively, commodities groups lost billions of dollars in the first weeks. This was the outcome of their positioning towards falling energy prices. Remember: everyone was anticipating a "super glut" year for the oil market on the back of a weaker global economy and recent increases in supply.
Part 9: Current Prices and the Structural Reality
What the Market Is Not Pricing In
The central argument of this article is that the visible market price of oil, Brent trading around $82-88 a barrel as of 10 August 2026, does not fully reflect the structural tightness of global energy markets. Several factors support this view.
First, the visible benchmarks (Brent and WTI) reflect conditions in the Atlantic basin, where strategic reserve releases and US export increases have provided temporary insulation. Regional benchmarks in Asia (Oman, Dubai) were trading at extraordinary premiums, reflecting true scarcity for the grades that Asian refiners need. Last week though, DME Oman closed at $79.37 on 8 August, therefore trading at a discount to Brent.
Second, the buffer mechanisms are exhausted. US SPR fell for a 20th consecutive week as of early August 2026, at 298.7 mb, the lowest since April 1983. China's destock has limits. OECD government inventories are at a 35-year low. US crude export capacity is being drawn from domestic inventory, not from production growth. No wonder OPEC+ agreed +188,000 b/d for September on 2 August, the sixth consecutive monthly increase, effectively ending the 2023 voluntary cuts. The next OPEC+ meeting scheduled early September is however expected to result in a pause in volume increase.
Third, gas markets, often overlooked in the crude price discussion, are showing acute stress. European gas prices up nearly 50% since late June, storage targets looking increasingly unachievable, and winter approaching is a combination that should not be dismissed.
Fourth, the ceasefire announced in April 2026 did not hold. The conflict resumed in July with new escalation even though more recent news indicates that Iran and Oman are close to a deal to reopen the Strait. While this could read as good news, the devil lies in the details. Iran has understood that neither the US nor Israel has the capabilities to pursue this war for much longer and is playing its strong hand into getting a very favourable agreement. The Iranians are pushing for an exclusion of US and Israeli vessels and for levying fees on hostile states. These remain negotiation points, but one thing is sure: the status of the Strait of Hormuz is about to change for a long time.
Let's also not forget a point: the threat of Iranian mines in the Strait represents a structural complication that persists independently of any ceasefire.
Fifth, and importantly, the Caspian Pipeline Consortium recently suspended crude loadings at its Black Sea terminal after tanker attacks, disrupting roughly 80% of Kazakhstan's oil exports. This is a supply disruption that has nothing to do with the Gulf, and it compounds the overall picture.
The Case for Remaining Cautious
It would be intellectually dishonest to present only the bearish case on prices without acknowledging the countervailing factors. If a credible, durable peace agreement is reached quickly, and if the Strait reopens fully and promptly, there could be a significant near-term oil price decline as Gulf producers race to empty their storage and rebuild their cash flows. During the recent ceasefire and peace negotiations, Brent fell from around 70 at the end of June.
But the scenario that concerns me most is not that prices stay elevated: that will resolve through either a peace deal or demand destruction. It is rather that the world enters winter 2026-27 with European gas storage substantially below target, ongoing disruption to Gulf exports, US inventories at multi-year lows, mines in the Strait that complicate any rapid reopening, and Chinese buyers returning to markets with full demand.
In that scenario, the buffers are truly gone. And the price response, in both oil and gas, could be material.
So, what shall we monitor in the coming weeks or months? The evolution of EU gas storage is a key one: is it on track to meet the 80% target on 1 November? The weekly US SPR direction, currently in its twentieth consecutive week of decline: the week it stops is a signal. The Brent front-to-six-month spread, where backwardation flattening is the short clock ending. But also the Brent-Dubai spread, which is the cleanest single test that things have settled in the Strait. And finally, whether ADNOC's West-East pipeline holds its 2027 date.
More broadly, physical indicators, such as record crack spreads, surging regional physical spot premiums, and depleted global inventories, are flashing red warning signals and must be monitored closely. > If EU storage is above 75% on 1 November and Brent-Dubai is still at parity, I was wrong.
I do not wish for this outcome. A world with oil sustainably above $120-130 per barrel would be economically damaging for hundreds of millions of people. The most honest position is to say: I hope I am wrong about the near-term price trajectory. But the structural evidence suggests that resolution, even if it comes, will take longer than markets currently assume to translate into restored supply.
To close this part on a touch of hope: at current refining crack spreads, high distillate costs (diesel, jet fuel) are actively curbing economic activity and freight transport in price-sensitive emerging markets. If demand drops fast enough, it could partially mask the physical supply deficit.
Part 10: When Rich Countries Outbid the Poor: The Emerging Market Dimension
The macroeconomic consequences of high oil prices are painful for developed economies. But we tend to forget that they are potentially catastrophic for emerging ones.
The distinction matters, and it tends to get lost in financial market commentary produced in London, New York, and Paris.
In developed economies, high oil prices create inflation, reduce real incomes, and put pressure on central banks. These are serious problems, of course. But most developed economies have access to strategic reserves, deep capital markets, relatively diversified energy mixes, and the financial capacity to absorb elevated prices for considerable periods. When Europe faced an energy crisis in 2022, it spent hundreds of billions of euros on consumer subsidies and emergency energy procurement. It could (somehow) afford to do so.
Emerging markets operate under entirely different constraints. Many African households still cook with gas or kerosene. Electricity grids in South Asia rely heavily on gas-fired power plants. These are not choices that can be quickly changed: they reflect decades of infrastructure investment and the economic realities of populations who cannot afford alternatives.
When global energy prices spike, these countries face a brutal arithmetic: either spend scarce foreign exchange reserves on expensive imported energy, or endure blackouts, industrial disruption, and food insecurity. They cannot do both... and many can only choose the former option for a very short period of time.
The Bangladesh Case --- Twice
Bangladesh illustrates this most clearly, and twice over.
In 2022, when Russia's invasion of Ukraine sent LNG prices spiralling, Europe scrambled to secure alternative supply volumes, outbidding more price-sensitive markets across Asia. Europe was trying to grab every molecule of gas wherever it was available, thanks to its higher purchasing power. As a result, Bangladesh suspended spot market LNG imports for seven consecutive months from July 2022, triggering widespread power cuts. At the height of the crisis, 20% of the country's electricity demand was unmet. Pakistan's foreign exchange reserves plummeted due to emergency LNG purchases at record prices, pushing it to the brink of default and necessitating an IMF bailout.
The 2026 crisis is repeating the same pattern with greater severity. Bangladesh's long-term LNG supply deal with QatarEnergy, which covers 20% of its LNG imports, was disrupted when the supplier declared force majeure following the Iran war. When Petrobangla floated a tender for emergency spot LNG in March 2026, it received zero bids. The spot price had jumped to $28 per MMBtu, more than 2.5 times its price of four days earlier.
This mechanism rarely appears in financial market analysis: when supply is constrained, wealthy consumers outbid poor consumers. Not through malice, but through the automatic workings of a price-clearing market. Neither you nor I even have to think about it. Europe's willingness to pay $60 per MMBtu for LNG to keep its heating running is rational from Europe's perspective. The consequence is that a family in Dhaka loses electricity.
The global energy market is a single market, and price signals clear it without regard for who can bear the consequences.
The IEA acknowledged this explicitly in its analysis of the 2022 crisis:
"The global LNG market proved to be a highly reactive link between regional fundamentals and global gas dynamics. European buyers scrambled to secure alternative supply volumes, edging out more price-sensitive markets with repercussions felt as far away as Bangladesh, India and Pakistan."
This dimension deserves more attention than it typically receives in commodity market reporting. The human cost of the 2026 oil and gas disruption is being felt most severely not in London or New York or Paris, but in countries whose names rarely appear in commodity market reports.
Conclusion: What I Take From This
I opened by saying there is no better way to understand a market than to study it under stress. Having spent six months watching this one, I would go further:
It is the only way you find out which parts were load-bearing.
What I take from it is this. The visible price has been the least reliable number on the screen all year. It stayed calm while Omani crude set records, while Asian refiners cut runs, while cracks hit four-year highs. Then it fell 7% in a week on a headline about a deal that is temporary, partial and still unsigned, before regaining all that loss within a few hours the following week on the back of a contradictory headline. > Paper markets price resolution like a switch. Physical supply obeys engineering, and engineering does not care what was announced on Friday.
That does not make me right about 2027. The long clock is real: OPEC+ is pumping, the UAE is out, demand is falling, and every producer sitting on reserves they may never sell has a reason to sell them now. Both clocks are running, and I have told you which numbers I am watching and what would tell me I got this wrong.
One last thing, and it is the part I would keep if you forget everything else.
This market clears on price, and price does not ask who can afford it. A family in Dhaka lost electricity so that a house in Europe could stay warm. Nobody decided that. It is simply what a single global market does when it runs short.
That is not a reason to look away from the price. It is the reason to learn to read it.
Resources for Going Deeper
Everything below is something I have either used or checked. Free and primary sources are marked as such, because a lot of the best material in this field costs nothing, including two full university courses.
If you only do one thing
Read Brian Potter's How an Oil Refinery Works (Construction Physics, free, one sitting). Crude classification, distillation, cracking, reforming, all anchored to a real plant, and it ends on the Nelson Complexity Index, which is the concept that makes every refining margin story in this article legible. It is also the single most upvoted thing I found on this subject anywhere, on an audience that is merciless about hand-waving.
Then, in this order
If you want a route rather than a pile, this is the one I would take.
- Get the shape of the industry. Potter's refinery piece above, then Morgan Downey's Oil 101: free, 26 chapters, chemistry through pricing. That is the bridge between the subsurface and the barrel, and it is current enough to carry a chapter on this crisis.
- Learn to read the market. Penn State's EBF 301: free open courseware, teaches the thing almost nothing else free teaches: how Platts and Argus actually assess a cash price, and how a hedge is put on. Do this before any book on trading.
- Get the numeracy. David MacKay's Sustainable Energy — Without the Hot Air, free. After this you can size an energy claim yourself instead of taking a scenario on trust. It is the layer underneath every demand forecast argued about in Part 4.
- Then the history, once the mechanics are in place and not before: Yergin's The Prize for the narrative, McNally's Crude Volatility for why violent swings are oil's natural state.
- Specialise last. Pick the branch you actually care about from the sections below, refining, drilling, gas, shipping, macro, rather than reading across all of them.
I read the history first. It is the most enjoyable entry point but also the least useful one, because you have no framework to hang it on.
Start here
- Daniel Yergin, The Prize: The Epic Quest for Oil, Money, and Power (Simon & Schuster, 1991). The history of the oil industry, and the pattern-library that makes chokepoint and cartel news legible rather than episodic. Nearly 1,000 pages, so a heavy read, and I am still working my way through it. Commenters flag Yergin's industry-boosterism openly and recommend it anyway, which is the more useful kind of consensus.
- Morgan Downey, Oil 101, 2nd edition (self-published, 2026). Free, all 26 chapters online. The single best bridge between the subsurface and the barrel. Self-published and not peer-reviewed, so treat the analytical chapters as one practitioner's read.
- David J.C. MacKay, Sustainable Energy — Without the Hot Air (UIT Cambridge). Free, full text. Teaches you to size any energy claim in kWh per person per day, with every input exposed for audit. MacKay was Cambridge Professor of Natural Philosophy and chief scientific adviser at the UK's energy department. It replaces the entire genre of "energy explained" books.
- Penn State, EBF 301: Global Finance for the Earth, Energy, and Materials Industries. Free open courseware (CC BY-NC-SA), twelve lessons, co-authored by a former physical energy trader. Contract specs, cash-market pricing methodology, the price reporting agencies, logistics, hedging, swaps and spreads. The only free source I found that teaches PRA methodology properly.
- Duke University / Coursera, Oil & Gas Industry Operations and Markets. Free to audit. The gentler on-ramp if EBF 301 is too dense. Videos without assignments run about three hours.
How the market actually prices
- Ilia Bouchouev, Virtual Barrels: Quantitative Trading in the Oil Market (Springer, 2023). Written by the former president of Koch Global Partners, who ran the derivatives book for two decades. The one book that treats the futures curve as a hedging-pressure equilibrium rather than a forecast, which is exactly the point I make about Bessent. Assumes comfort with algebra.
- Adi Imsirovic & Kurt Chapman, The New Forward Brent Benchmark (OIES, 2023). Free PDF. How Dated Brent is actually assessed, and why WTI Midland was admitted to the basket. If you quote Brent, you should know the benchmark is now partly American.
- "Dr. Shakalu", Physical Oil Trading Basics (Wall Street Oasis). Free. A former trading-house risk manager walks a single cargo through the five things that define a trade: the publication that prices it, the pricing window, the Incoterm, the spec, the formula. Stress-tested in seventy-odd comments by other traders, which is why I trust it.
- John Kemp, JKempEnergy. Daily analysis of inventories, positioning, the curve and refinery runs, by Reuters' senior energy analyst from 2008 to 2024. Now independent; access has changed more than once since he left, so check the current free tier before relying on it.
- CME Group Institute, Introduction to Crude Oil. Free, ~75 minutes. An exchange explaining its own products, so read the framing accordingly.
- OPEC Secretariat, Monthly Oil Market Report. The only monthly balance published by the producers themselves. Read it alongside the IEA rather than instead of it: the divergence is the informative object.
Commodity traders and how they are financed
- Javier Blas & Jack Farchy, The World for Sale (Oxford University Press, 2021). The best book written about commodity trading firms. It won the FT Business Book Award and reads more like a thriller than a financial textbook.
- Daniel Ammann, The King of Oil (Macmillan, 2009). Biography of Marc Rich, founder of Glencore and inventor of many of the structures these firms still use. A. Craig Copetas's Metal Men (Perennial, 2001; first published 1985) is the critical counterpoint on the same story.
- Trafigura, Commodities Demystified, 2nd edition. Free. The clearest published walk-through of a physical trade, from origination through freight and hedging to the financing underneath. A trading house describing itself, so the risk and conduct sections are the sanitised version.
- Javier Blas, Inside the commodity markets in 2020–23 (ECB Forum, Sintra, 2023). Free. Written for central bankers rather than for readers of his own book. The strongest short account of how traders fund themselves on short-term bank debt, and why 2022 was briefly a solvency question.
- Craig Pirrong, The Economics of Commodity Trading Firms. Free PDF. He interviewed traders, operational staff and senior management at Trafigura to write it.
- Davis W. Edwards, Energy Trading & Investing (McGraw-Hill, 2nd edition, 2017). Paid. Covers crude, products, gas, LNG, power and emissions with the structuring and risk management on top. Worth it only if you need the sectors Oil 101 stops short of; otherwise the free stack above gets you there.
- Geoffrey Wynne, A Practitioner's Guide to Trade and Commodity Finance (Sweet & Maxwell). The technical reference for commodity finance structures. Not light reading, but definitive.
- HC Group, The HC Commodities Podcast. Interviews with heads of trading, risk and origination. Produced by a recruitment firm, so guests are polite about their employers, but it is the closest thing to hearing how the desks talk.
OPEC, cartels and chokepoints
- Robert McNally, Crude Volatility (Columbia University Press, 2017). Violent price swings are oil's natural state; the calm periods were engineered, first by Standard Oil and the Texas Railroad Commission, then by OPEC. A practitioner's history as McNally was a White House energy adviser. Predates 2020 and 2022 but explains both.
- Rosemary A. Kelanic, Black Gold and Blackmail (Cornell University Press, 2020). What great powers do in advance when they fear their oil can be cut off, and why they usually over-insure. Political science rather than markets; there are no prices in it.
- Nicholas Mulder, The Economic Weapon (Yale University Press, 2022). How consistently sanctions produce the adaptation they were meant to prevent. Directly relevant to Russian barrels finding buyers in the east. Stops in 1945; you supply the modern application.
- U.S. Energy Information Administration, World Oil Transit Chokepoints. Free primary source. The baseline against which any disruption claim should be checked. The IEA's Strait of Hormuz factsheet is the better single-chokepoint companion.
The great shocks
- James D. Hamilton, Historical Oil Shocks (NBER WP 16790, 2011). Free. Every significant disruption from 1862 to 2008, each with the quantity lost, the price response, and the recession that did or did not follow. The reference point for asking whether a 14 mb/d loss "should" have moved Brent more than twenty dollars.
- Olivier Blanchard & Jordi Galí, The Macroeconomic Effects of Oil Price Shocks (NBER WP 13368, 2007). Free. The formal version of the oil-burden argument, and unlike the popular version it tells you which channel does the work. Predates shale.
- U.S. Commodity Futures Trading Commission, Trading in NYMEX WTI Crude Oil Futures around April 20, 2020 (2020). Thirty-six pages of forensic detail on the minus $37.63 settlement. The definitive account of the mismatch between financial contracts and physical reality.
- World Bank, Understanding the Plunge in Oil Prices (2015). Free chapter. The cleanest contemporaneous statement of the market-share logic behind Saudi behaviour in 2014.
Under the ground
- Norman J. Hyne, Nontechnical Guide to Petroleum Geology, Exploration, Drilling & Production (PennWell, 4th edition, 2019). Do not let "nontechnical" fool you. The best comprehensive bridge between geology and drilling mechanics.
- Paul M. Bommer, A Primer of Oilwell Drilling, 7th edition (PETEX, UT Austin). The rung nothing else occupies: the whole drilling sequence, illustrated, with no calculus, between Hyne's breadth and Bourgoyne's mathematics. Developed with the International Association of Drilling Contractors and used for workforce credentialing, which is standing earned from employers rather than publishers.
- Stanford Precourt Institute, Drilling, Completing, and Producing from Oil and Natural Gas Wells. Five short videos, a full Stanford lecture and a quiz. US onshore and shale-weighted, and near-silent on shut-in and restart.
- Society of Petroleum Engineers, PetroWiki and AAPG, AAPG Wiki, both free. The engineering and geology lookup layers, built from the SPE handbook and the AAPG Treatise respectively. Quality varies where contributors have edited away from the source text.
- Bourgoyne, Millheim, Chenevert & Young, Applied Drilling Engineering (SPE Textbook Series Vol. 2). The "red book", on almost every drilling engineer's shelf but not on mine as very much niche.
- Prof. Pankaj Tiwari, Petroleum Reservoir Engineering (NPTEL / IIT Guwahati, 22 lectures). Free. Reservoir engineering at degree depth: fluid and rock properties, material balance, drive mechanisms, recovery factors. The discipline the other books here leave out, and the cheapest way to find out whether it interests you before buying Dake.
- Economides, Hill, Ehlig-Economides & Zhu, Petroleum Production Systems (Prentice Hall, 2nd edition, 2013). The physics behind the shut-in section: skin effect, well deliverability, flow in horizontal wellbores, artificial lift. Assumes calculus.
- Richard C. Selley & Stephen A. Sonnenberg, Elements of Petroleum Geology (Academic Press, 4th edition). Oil generation chemistry, reading seismic, and the stratigraphic traps that hold hydrocarbons.
Refining
- Penn State, FSC 432: Petroleum Refining. Free open courseware (CC BY-NC-SA), twelve lessons by Prof. Semih Eser: crude assay, separation, thermal and catalytic conversion, finishing, refinery economics, plus a full lesson on natural gas processing. Readable without login. Do this and you do not need to buy a refining textbook unless you are going to work in one.
- Kaiser, de Klerk, Gary & Handwerk, Petroleum Refining: Technology, Economics, and Markets (CRC Press, 6th edition, 2020). The reference, and unusually the first half is the business half: yields, margins, product pricing and complexity metrics. This is where run cuts and crack spreads are grounded. Priced as a reference work; go here only after FSC 432.
- U.S. Chemical Safety Board, Transient Hazards: Explosion at the Husky Superior Refinery (2023). A narrated reconstruction of a unit shutdown that went wrong. Directly relevant to why refiners hate stopping. Its companion on the Philadelphia refinery does the same for an alkylation unit.
Gas and LNG
- Michael D. Tusiani & Gordon Shearer, LNG: Fuel for a Changing World (PennWell, 2nd edition, 2016). Liquefaction, shipping, regasification, plus long-term contracts, destination clauses and pricing formulas. Predates the 2022 repricing, so use it for the plumbing, not the market picture.
- International Gas Union, World LNG Report 2026. The industry's census. Produced by the industry's own association, so read the demand outlook accordingly.
- Gas Infrastructure Europe, AGSI, free, daily. European gas storage by country and operator, with an API. The primary source behind every "EU storage is at X%" headline, including mine. Watching it through one injection season teaches more than any commentary.
- Oxford Institute for Energy Studies, Gas Research Programme. The best independent analysis of European gas and LNG. Written for people who already know the plumbing; start with Tusiani.
Ships, freight and war risk
- Marc Levinson, The Box (Princeton University Press, 2nd edition). Why shipping is a chronically overbuilt, thin-margin, boom-bust industry rather than a stable toll business. The single most recurrently recommended book in this whole search, it surfaced across twenty-eight independent threads. I had not read it prior to this article and just bought it.
- Martin Stopford, Maritime Economics (Routledge, 3rd edition, 2009). How shipping markets clear: freight rate formation, voyage costs, and cycles reconstructed back to 1741. If you want to understand why a Gulf–China rate can quadruple, this is the framework. Nothing on the post-2022 shadow-fleet era, and an 800-page commitment.
- Baltic Exchange, Guide to Market Benchmarks, free PDF. How the tanker indices are constructed. Read it and the freight numbers in the press stop being abstractions.
- Cefor, The Nordic Marine Insurance Plan. Free and searchable. Chapter 15 covers war risks: perils insured and excluded, conditional trading areas, notification duties, automatic termination. The best free route to understanding what war-risk cover does and does not do, because you are reading the wording with the drafters explaining it clause by clause. Nordic rather than London market.
Demand, the transition and the terminal horizon
- IEA, World Energy Outlook 2025, free. The document everyone else argues with. Read it as a scenario set, not a forecast, and read Cozzi & Gould's Scenarios in the World Energy Outlook 2025 first. If you do not know which scenario a headline came from, the headline is meaningless.
- OPEC Secretariat, World Oil Outlook 2026, free. The producers' long-term view: no peak in sight. A house view from an interested party, which is precisely why the gap between it and STEPS is worth studying.
- IEA, Global EV Outlook 2026, free. Where the road-fuel displacement numbers in this article come from. Strong on the vehicle side, thin on what displacement does to refinery product yields.
- Jean-Marc Jancovici, Cours des Mines ParisTech (Mines Paris – PSL, eight lectures). Free, with English subtitles. The physical coupling between energy supply and GDP, taught as actual graduate coursework. The best available answer to "why doesn't the economy just decouple from energy", and directly load-bearing for the long clock in Part 4.
- Hans-Werner Sinn, Public policies against global warming: a supply side approach (2008). Free PDF. The origin of the green paradox, and the formal basis of the terminal-horizon and "run on the bank" logic I use in Part 4.
- Frederick van der Ploeg & Cees Withagen, Global Warming and the Green Paradox (OxCarre WP 116, 2013). Free PDF. When extraction costs, reserve heterogeneity and a well-designed carbon tax make the paradox disappear. If you lean on the mechanism, know when it fails.
- Nathaniel Bullard, Decarbonization: the annual presentation. Free. A several-hundred-slide annual chartbook on where transition capital and demand actually stand, by BloombergNEF's former chief content officer. Free where the equivalent is a paid research seat.
Who pays
- IEA, IRENA, UN DESA, World Bank & WHO, Tracking SDG7. The official stock-take on electricity and clean cooking access. Measurement rather than analysis, but it is the number everyone else cites.
- Black, Parry, Vernon-Lin et al., Underpriced and Overused: Fossil Fuel Subsidies (IMF WP, 2025), free, with the dataset. Read the definitions before quoting the headline: "implicit" prices in unpriced externalities, which is a modelling choice.
- World Bank, Commodity Markets Outlook and the Pink Sheet, free. The best short treatment of the gas–ammonia–urea–food chain, plus seventy-odd price series in a spreadsheet, updated monthly.
- Michael L. Ross, The Oil Curse (Princeton University Press, 2012). Why petroleum revenue makes states less accountable. Empirical rather than polemical. The short free version is his What Have We Learned about the Resource Curse? (2015).
- Jim Krane, Energy Kingdoms (Columbia University Press, 2019). Subsidised energy as part of the ruling bargain, and why runaway domestic consumption eats the export barrel.
Watch and listen
- David Woo Unbound, Former Bank of America Head of Global Rates and FX Research, now independent. Game-theory-based analysis of markets and geopolitics, consistently ahead of consensus on this crisis. His The Market Is Completely Wrong About Iran, Oil & What Comes Next is directly relevant to this article. This is one of the YouTube channels I watch the most.
What I left out, and why
Because a reading list is only trustworthy if you know what it rejected.
Cut for redundancy. Fundamentals of Drilling Engineering: it is the modern successor to Bourgoyne's red book, which means it teaches the same thing at a different vintage. Pick one. Leffler's Petroleum Refining in Nontechnical Language is deemed genuinely good, but Potter's free essay plus Penn State's free course now occupy that slot better and cost nothing.
Cut for age. MIT OCW 14.44 Energy Economics is by the right person but predates shale, the LNG buildout and negative prices, and only the syllabus survives. Dake's Fundamentals of Reservoir Engineering is canonical and from 1978.
Cut for access. The ICC Trade Register Report has the industry-standard default tables and starts at €2,500. GIIGNL's trade matrix and Worldscale's freight schedules are both member-only. RBN Energy is widely praised as free and is not.
Deliberately not included. 1000 Barrels a Second, recommended often, written pre-fracking. Kingsman's Out of the Shadows is excellent on agricultural trading houses (and sits on my book pile) but this is an oil piece. Sachs & Warner's founding resource-curse paper has been picked apart on identification: Ross covers it better.
A gap I could not fill. There is no good free resource on the London war-risk market specifically: the Institute War and Strikes Clauses are not public. The Nordic Plan above is the workaround, and it is a genuinely different market.
A caveat on method: the community-consensus leg leans on Hacker News, Wall Street Oasis, Stack Exchange and published university syllabi. Where a title is here because it recurred across many independent threads rather than because an institution stands behind it. This is how I found some of the resources I had read or watched well before the writing of this article.
This article was written between late July and 10 August 2026. All price references reflect market conditions at that date, and in a market moving this fast some will already be stale by the time you read this. This article represents a personal analysis, not financial advice, and does not represent the views of my employer.
Go deeper
Test your understanding of oil-and-gas-markets
Explain it out loud. An AI tutor listens and asks questions that expose gaps you didn't know you had.